Page 3 of 12
Posted: Fri Jan 06, 2006 2:55 pm
by CureOrBust
ok, i got the prokarin yesterday.
My chemist told me there is a new formulation of the histamine, but that wont be available for another week. I said i didnt want to wait, and would try the existing one (in case it ends up longer than a week).
I also just finished my last day of a 5 day pulse of flagyl from my abx's. With no negative reactions.
Ill keep you all informed how i go with the prokarin.
Posted: Sun Jan 08, 2006 3:25 am
by CureOrBust
I got my prokarin on Friday afternoon.
I have read the instructions, and its best to slowly build up the dosage, so I have yet to reach the full dose (but i am ahead of schedule...)
So far, I think I have noticed slight improvements. but they could be just part of my general healing i have experienced. Time will tell when i reach the full dose.
(Statins, LDN & ABX's and now Prokarin... as well as Curcumin, Inosine & other suppliments)
Posted: Wed May 10, 2006 4:28 am
by CureOrBust
I gave Prokarin a few months trial, and i could not say for certain it improved things, so i stopped.
I have been improving, but its hard to say by how much and if consistant, so I decided to start keeping track of it in a little more scientific way. I found that i feel weakest when walking down stairs, so i started using my cross-trainer in reverse to try and simulate this. I started to plot it, and over time I am getting the following.
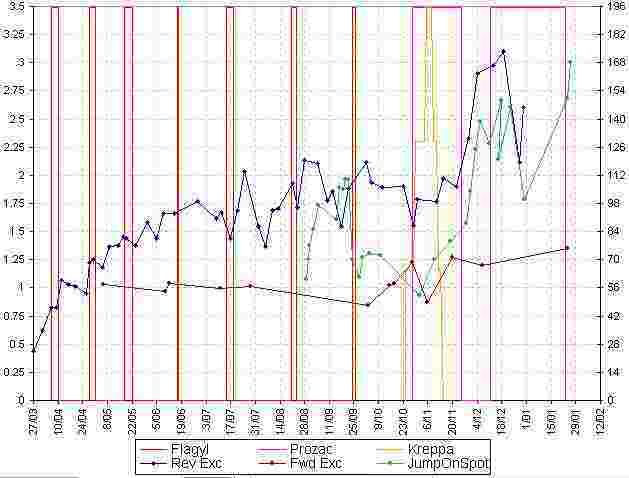
The graph is actually a weighted line based on distance, calories and time. The verticle lines show the days i stopped a flagyl pulse on. The big "dip" in the middle of the graph was just after i had two flu's back to back (a flu being my trigger for a relapse).
The graph I think actually looks better than what i actually feel. But this improvement has made it clear to me that my new "weakness" is in my ability to straighten my leg from slightly bent. This will be my new focus.
Its a pity I didnt track this since i started all my "wierd" protocols, but, one of the reasons was that i was too weak to use my cross-trainer.
Posted: Wed May 10, 2006 2:44 pm
by Arron
applause... nicely done. Stepping away from the subjective to the objective is difficult and time-consuming, but quite satisfying. And I'm very happy to see the slope of your graph is quite positive!
Posted: Thu May 11, 2006 9:26 am
by wiggy
That is a wonderful graph - thanks for posting!
Posted: Thu May 11, 2006 9:42 am
by SarahLonglands
My goodness, Cureo, graphs seem to be the in thing at the moment, but this one looks very impressive!
Posted: Thu May 11, 2006 5:50 pm
by Brainteaser
Hi COB,
The graph looks good!.......but reminds me of the daily increase in petrol/gas prices!
Just for clarification, I don't completely understand the verticle scale, although it seems a measure of improvement. The horizontal axis is clearly time/dates, and therefore it seems as if you experienced significant improvement between 8/4 and 13/4 during the 5 day flagyl pulse but then dropped back. Is this correct?
Thanks,
Phil.
Posted: Fri May 12, 2006 6:11 pm
by CureOrBust
Brainteaser wrote:but reminds me of the daily increase in petrol/gas prices!
If only they would have a relapse, or become secondary progressive...
Brainteaser wrote:Just for clarification, I don't completely understand the verticle scale, although it seems a measure of improvement
The cheap "computer" on my cross trainer tracks Time, Calories, instantaneous speed and Distance. Originally i was plotting time, distance and colories leaving me with 3 graphs on different scales. To simplify this i worked out a "weighting" system to combine these into a single line.
I drew a line in the sand to extrapolate each of these to one, then averaged the three. So for Calories I choose 30, for time I chose 5minutes and 6seconds (ie 306 seconds) and for distance I chose 0.9. These numbers roughly equate to the readings I had on 12/4/06. By the way, I have the resistance set to the max (which doesnt feel that high at first, but takes its toll after a few minutes)
So for example, on 12/4/06
Calories were 36.2
Time was 5:05 = 5 * 60 + 6 seconds = 306 seconds
Distance was 0.9
and on 9/5/06
Calories were 45.3
Time was 6:25 = 6 * 60 + 25 = 385 seconds
Distance was 1.2
Therefore
Y (12/4/06) = ( 36.2 / 30 + (5 * 60 + 6) / 306 + 0.9 / 0.9 ) / 3 = (1.21 + 1 + 1) / 3 = 1.07
And
Y (9/5/06) = ( 45.3 /30 + (6 * 60 + 25) / 306 + 1.2 / .9 ) /3 = (1.51 + 1.26 + 1.33) / 3 = 1.37
Does this make it clearer?
Brainteaser wrote:The horizontal axis is clearly time/dates, and therefore it seems as if you experienced significant improvement between 8/4 and 13/4 during the 5 day flagyl pulse but then dropped back. Is this correct?
I have to admit, the verticle lines are not that accurate. They are drawn on, and once I added a new data point, the horizontal scale moved while the verticle lines stayed were they were, so I quickly pushed them back.
I have worked out a way to get the flagyl pulses "plotted" on the graph so they will be accurate markers of the start and stop of a pulse, and have updated the image.
Make sure you refresh the page, to ensure you get the updated image in the previous post.
Posted: Sat May 13, 2006 11:55 am
by gibbledygook
Hey Cureorbust,
Your chart is fantastic! How do you get the image onto the webpage? I've also got a graph based on less stringently monitored data but it would be fun to stick it on the website,
alex
Posted: Sat May 13, 2006 3:25 pm
by CureOrBust
gibbledygook wrote:How do you get the image onto the webpage?
I asked the same question, and Arron told me about
www.photobucket.com in the site support section.
You create an account (free), upload your image, copy the URL and paste it in a post.
Posted: Sun May 14, 2006 5:19 am
by gibbledygook
Excellent! Thanks.
Posted: Sun May 14, 2006 4:47 pm
by Brainteaser
Hi COBber,
Thank you for the update on your graph.............. Yes, graphically I understand it a little better now that it is changed, although I must confess that you have 'baffled me with science' regarding the vertical calculations!

...............but that is OK because science baffling and MS seem to go hand in hand!

Keep up the good work! This kind of monitoring should be helpful for your own recovery and an assistance to others.
Regards,
Phil.

Posted: Mon May 15, 2006 2:27 am
by CureOrBust
I have added another data point to the graph.
Be sure to refresh the page to make sure you get the latest image.
Posted: Wed May 17, 2006 4:09 am
by CureOrBust
I have added another data point to the graph.
Be sure to refresh the page to make sure you get the latest image (there should be a point past the 15/05 verticle for tonight the 17/05).
I am starting to get worried as to how long i can keep up this graph going in the positive direction...
I am also switching to Tinidazole instead of Flagyl for the next pulse, which I plan to start tomorrow.
Posted: Wed May 17, 2006 5:44 am
by Katman
Hi CureO (or COB -- I like that)
Want to wish you well on your coming/present adventure with tini. I tried it instead of flagyl 3 weeks ago and am using it this time, also. It was much easier for me, leaving my mind more intact and more connected to my emotions though the loss of coordination during dnd a week after the pulse were comparable. Keep us posted and best luck.
Rica