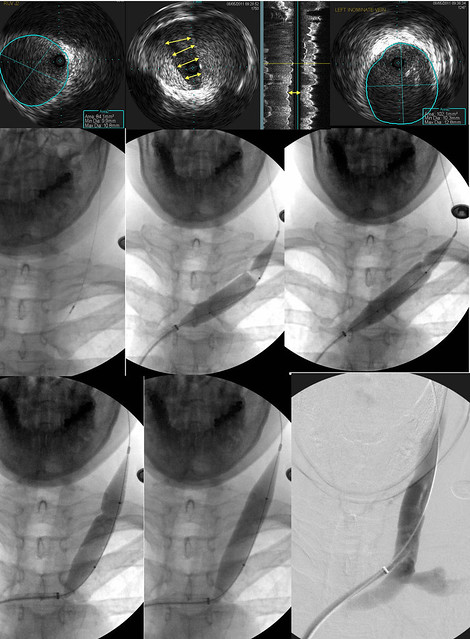
After completing treatments of the left internal jugular vein, the left subclavian vein and the left innominate vein. We are now in the third hour of this marathon procedure.
Catheterization of the azygous vein was performed, thankfully without major difficulties.
The image is below:
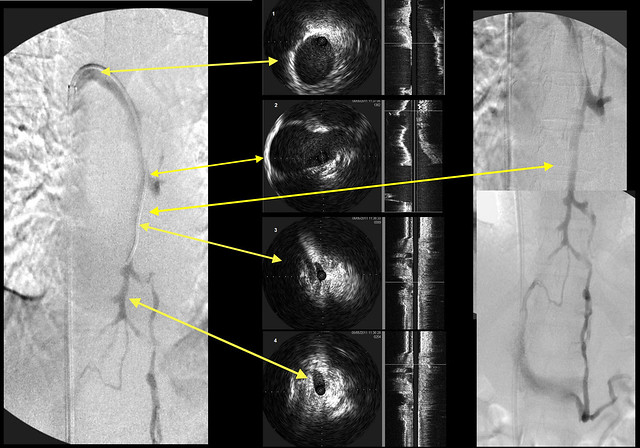
I usually start by placing the catheter distally within the azygous vein and then withdraw toward the connection with the superior vena cava. This case suggests that there are possible problems with this methodology. Let me mention (to reduce confusion) that the venograms are displayed (going left to right) as follows: the first venogram performed, a series of IVUS images performed after venography (yellow arrows pointing to corresponding venographic locations), to a composite of the entire azygous and hemiazygous.
On the left, one sees irregular narrowing of the midportion of the azgyous. The corresponding arrow on the IVUS images shows a very narrow segment, smaller than the more distal part, that then enlarges as it travels to the IVC.
Note the very long arrow comparing two different images of the midportion. It seems to me that the midvein is larger on the right picture than on the left.
Note also that there is strong retrograde flow that results in contrast filling of the hemiazygous vein back to the left renal vein.
So i am left with a quandry. Is this midazygous narrowing artefactual, perhaps caused by spasm? or is it a real stenosis of collapse?
drsclafani wrote: The patient is a 52 year old female diagnosed with MS in 1998. She was originally diagnosed with RRMS but states that she never has classical relapses but rather mostly steadily progressive disease. She says that she has difficulty finding words sometimes but states that her memory is good. She has debilitating fatigue which exaccerabates symptoms such as difficulty swallowing, balance, tightness in her arm, coordination and spasticity.
She has had therapy with rebif, amantadine, LDN and in 2007 underwent an 18 month course of low dose cytoxan for MS administered through an implanted port.
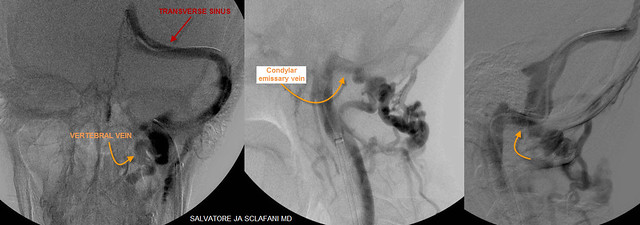
The catheter was placed in the left transverse sinus.
Dural sinus venography looked like this:
These images show that the transverse sinus and the sigmoid sinus had normal diameters. However there was a prominent connection between the transverse sinus inside the skull and the vertebral vein and posterior cervical branches on the outside. These vessels are connected by a very large emissary vein traversing across the skull via the hypoglossal canal. This canal is usually a very small opening in the skull but in this patient it is exceedingly large. I think this suggests that a long standing (perhaps congenital) outflow obstruction of the internal jugular vein has existed.
The catheter was then withdrawn into the internal jugular vein.
Venography looked like this:
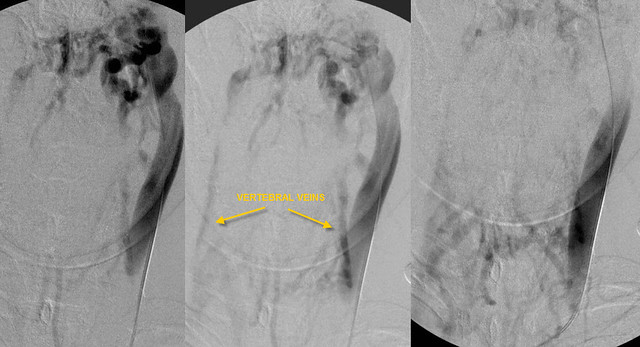
These images show very slow flow down the internal jugular vein. The majority of the flow is through collaterals involving the vertebral veins (yellow arrows). Other collaterals extend across the midline as well involving the face, spine and neck.
Note the failure of the contrast to exit the jugular vein.
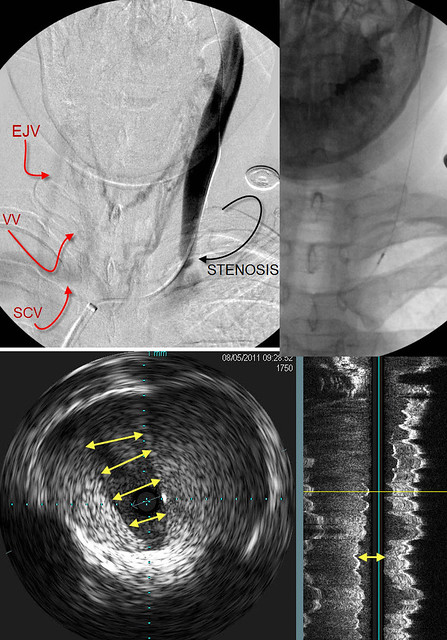
The catheter was positioned lower in the internal jugular vein and the venogram was repeated. Then intravascular ultrasound was performed. Note the location of the probe in the upper right image.
The upper left image shows the area of stenosis (black curved arrow). Minimal contrast exits the IJV; Collaterals are seen crossing the midline to opacify the External jugular vein (EJV), the vertebral vein (VV) and the subclavian vein (SCV). Other collaterals are seen in the midline.
The Left bottom image is an IVUS image at the level of the probe. The valve was persistently closed. The dense white tissue represents the valve tissue, thickened and immobile.
The image on the bottom right is another view. It shows a narrowed valve (double arrow). Dense tissue is evident on both sides of the arrow.
I rely upon IVUS to plan treatment of these stenoses.
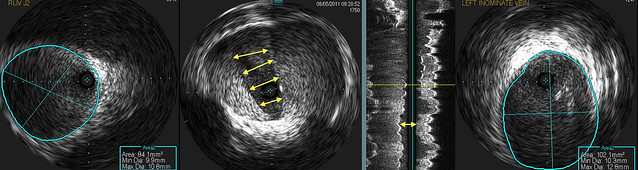
I rely upon IVUS to plan my treatment. I use it to decide what size balloon to use and where to position the balloon. These three images show the valvular stenosis and an image above (LEFT) and below (RIGHT) the valve.
I think that the valve is quite thick manifested by the brightness of the echoes on the valve. I think that a somewhat larger balloon may be necessary. So on the LEFT the vein measures 84 mm2 in cross sectional area. This is equivalent to a 10 mm balloon. Below the valve (RIGHT), the vein measured 102 mm2. That is close to a 12 mm balloon (113 square mm). That means the the minimum balloon I would use would be a 14 mm balloon which has a cross sectional area of 154 mm2.
That is a really big balloon to inflate on that upper jugular vein especially on the left side where there is a angle between the orientation of the vein and the orientation of the balloon.
So IVUS tells me that i need to position as much of the balloon BELOW the valvular stenosis.
In this case, the valvular tissue is thick and will require a strong angioplasty. I have included images above and below the area of valvular stenosis because they are important in deciding what size balloon to use and how to position it.
The image on the LEFT is above the injury. The cross sectional area is 84mm2. This is slightly larger than a 10 mm balloon. The image on the RIGHT shows the vein BELOW the valve.The cross sectional area measured 102 mm2, slightly less than a 12 mm balloon. So we surely will have to start with a 14mm balloon which has a cross sectional radea of 154 mm2. That is more than twice the cross sectional area of the vein above the stenosis. On the left jugular, because of the angle of the vein compared to the balloon, this is a bit riskier for dissection.
It because critical that I position this balloon so that the majority of the balloon is below the stenosis where the vein is of a dimension that can more easily accomodate the 14 mm (and possibly a 16mm) balloon.
This next sequence shows that decision in action.
The uper row again shows the IVUS exam. The middle row (Left) shows the IVUS probe at the level of the valve stenosis. It is just below the second rib. I attempted to place the upper shoulder of the 14 mm balloon (note the black dot at the waist on the balloon) exactly at the valvular stenosis (MIDDLE). Unfortunately I cut it too close and the balloon slipped below the stenosis. (RIGHT) The balloon was deflated and repositioned.
The lower row shows the new position of the balloon. Thus there is a small amount of upper vein that will be subjected to a fairly large distension (double in cross sectional area). The waist on the balloon (indicative of resistance to dilation) was overcome with 18 atmospheres of pressure. The post dilatation venogram shows a really nice diameter.
Unfortunately, there was still slow flow....
But that is a story for another day
Any questions so far?