Robnl wrote:Hi Doc,
The left internal jugular vein was thought to be 30% stenosed and it was treated by a balloon that seems undersized balloon
- Is 30% enough to balloon? A.k.a. from what percentage do you think it's useful to balloon?
- How do you 'see' that an undersized balloon is used?
This is a good question. The conventional thought revolves around 50% stenosis. But this was an arbitrary determination in arteries. But such percentages seem to be associated IN ARTERIES with pressure gradients where the pressure drops on the distal side of the stenosis. Moreover in arteries you can chemically exaggerate the drop in pressures by administering certain medications that can resemble the effects of stress so that we have the ability to correlate pressure with degree of stenosis.
Veins are much different because they are about flow not pressure. gradients across stenoses can be as little as 3mm and be significant. Also with significant flow veins expand greatly unlike arteries that are relatively stable in their size.
When flow increases and size increases the stenoseis is exaggerated and the stenosis appears to be a greater percentage.
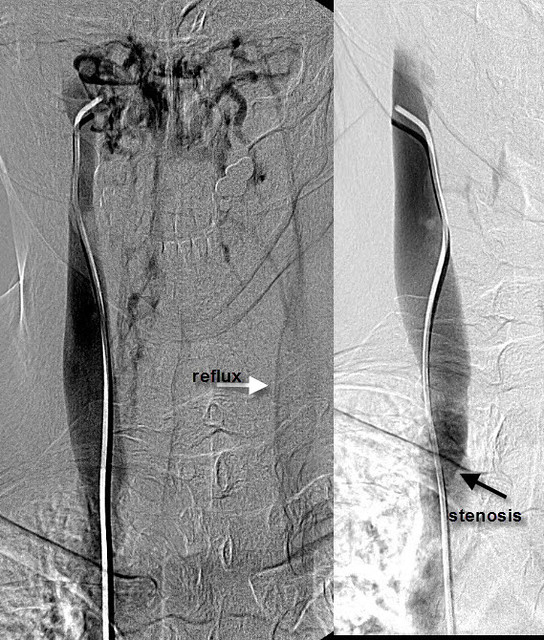
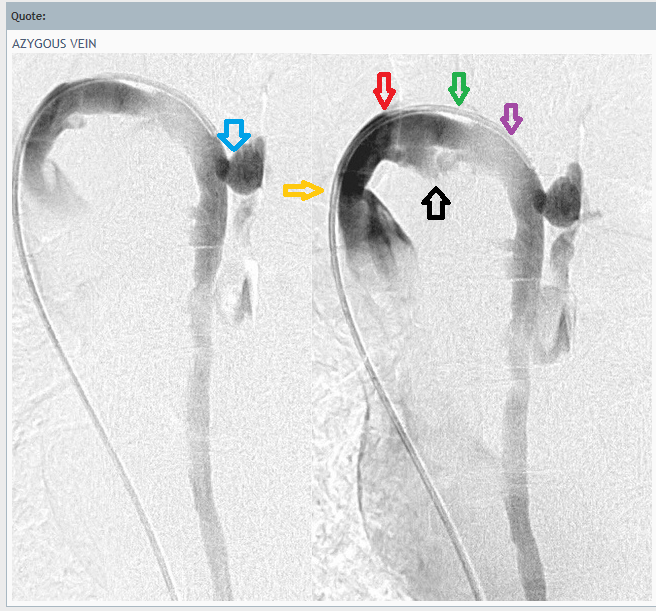
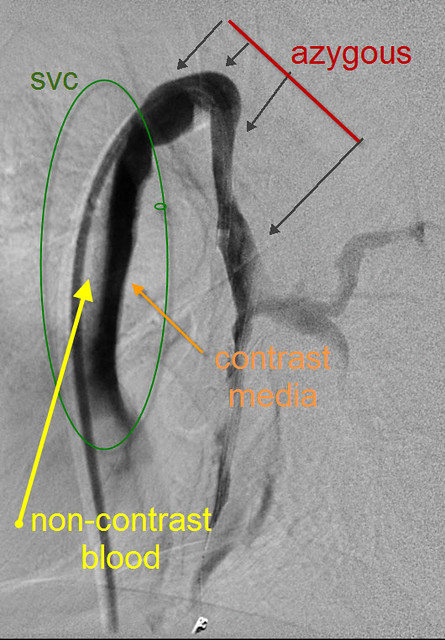
So it is not so simple. I use secondary signs of venous obstruction, including large collateral veins, slow flow, reflux or to/from movement of the contrast media and stasis of the contrast media.
and i use IVUS which is overwhelmingly better at determining constriction of the dimensions of a tube. while we can see a slight narrowing in one direction on venogram, the irregular shapes of veins may mislead us in that one view. Diameter measurements do not reflux the dimensions of a vein like circumference measurements do. IVUS gives us circumference measurements that are accurate to a tenth of a square millimeter. Also circumference is calculated as a square of the radius which magnifies any differences compared to measurements using diameter.
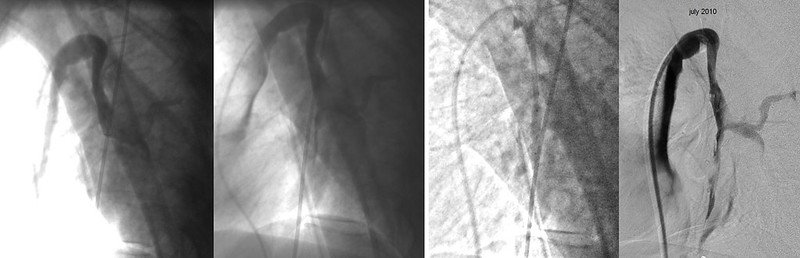
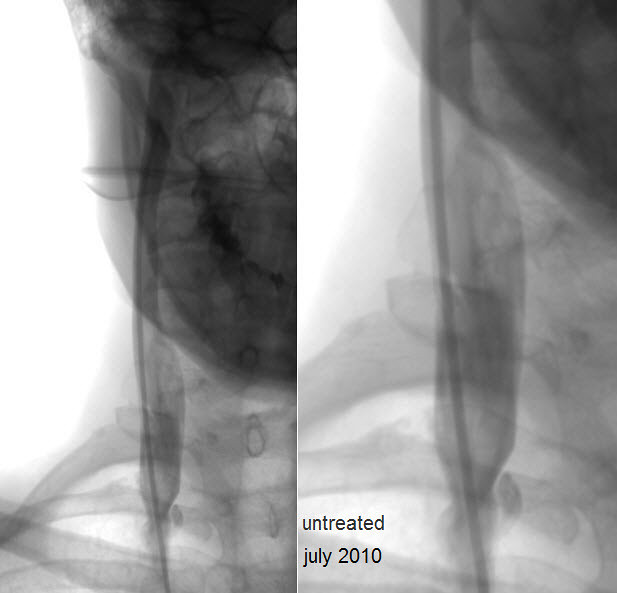
So lets look at the images used by the prior physician and compare to the images i create to make this determination.
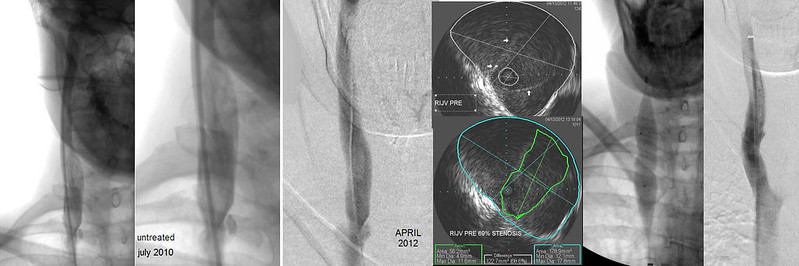
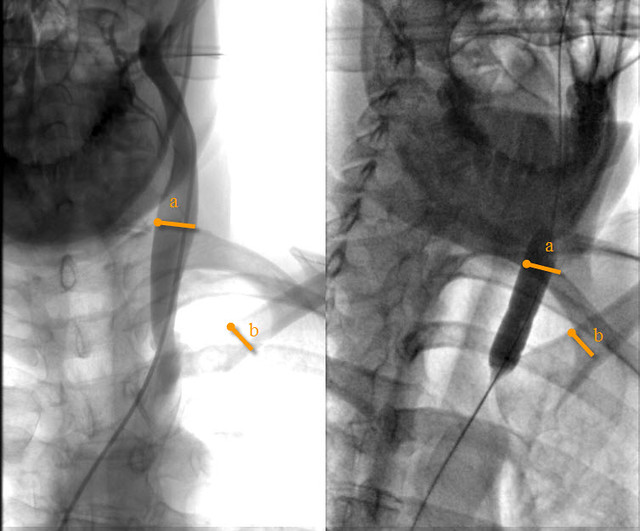
you saw these two images on the far left when i presented the case. I thought it was more significant that the prior physician and I would have treated it if it were my patient at that time. The next image to the right shows my venogram done this month. You can see that there is not much difference from the first two in terms of the stenosis.
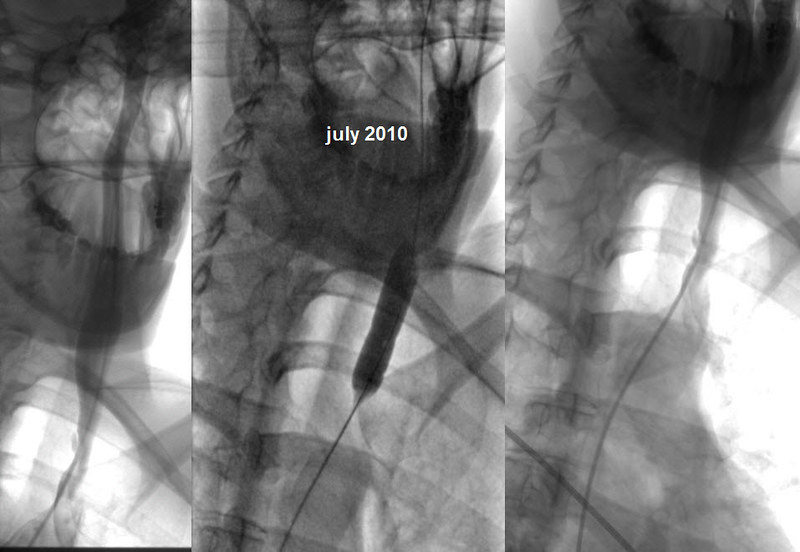
The next two images are IVUS images of the area of the stenosis. The upper one shows the valvular tissue with small white arrows indicating the opening of the valve. THIS is the stenosis as all the blood above must travel through this constriction of the valve. The lower images is the SAME image with blue outlining the dimensions of the vein and the green outlining the dimensions of the opening of the valve. It may be difficult to read, but below this are m easurements of the circumferences of the two and one can see that the percentage difference of the two circumferences is close to 70% and this would lead to no disagreement by anyone. Moreover this is NOT subjective, it is inarguable measured fact. The last two images show the constrictions in the balloons during dilation and the end result with the vein wide open, very rapid flow and a successful treatment.
That is how i do it.
i have to go to work, but i will explain why i think the left balloon was undersized. and how i determine what size balloon to use.
Thanks for asking
DrS